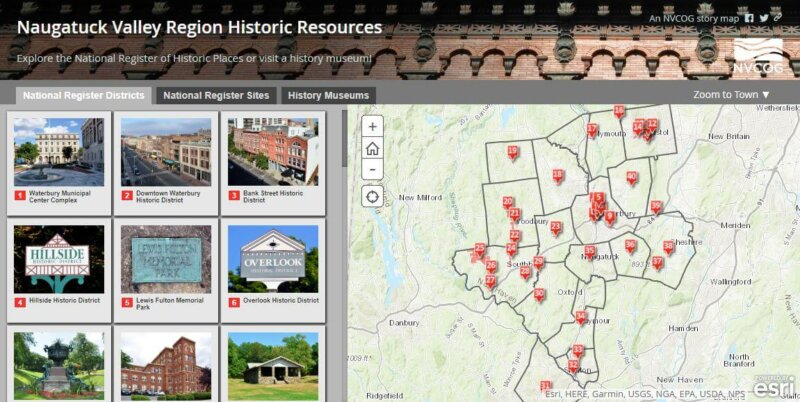
Explore the National Register of Historic Places or visit a history museum in the Naugatuck Valley. Includes links to the original NRHP submission material.
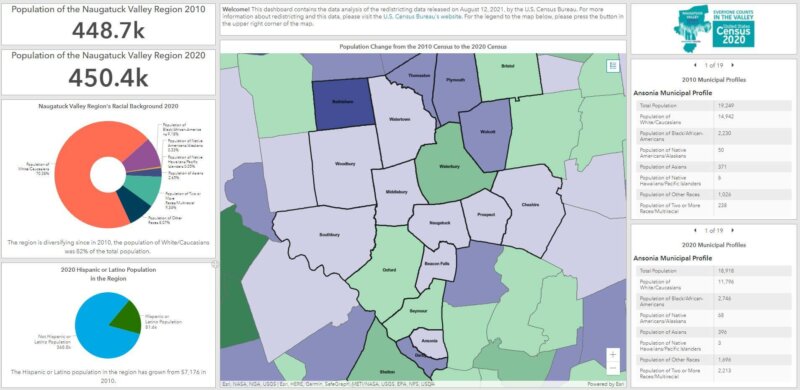
2020 Census Redistricting Data Dashboard
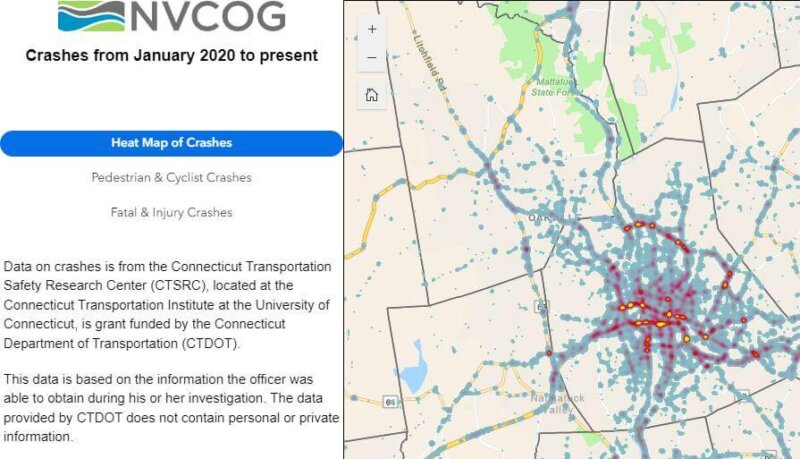
NVision Zero Crash Map
Cheshire Land Use
This map was created using land use data derived from 2012 NAIP satellite imagery, 2012 leaf-off aerial photography (CTDEEP), Google Streetview 2015 and municipal assessor information.
Bethlehem Land Use
This map was created using land use data derived from 2012 NAIP satellite imagery, 2012 leaf-off aerial photography (CTDEEP), Google Streetview 2015 and municipal assessor information.
Beacon Falls Land Use
This map was created using land use data derived from 2012 NAIP satellite imagery, 2012 leaf-off aerial photography (CTDEEP), Google Streetview 2015 and municipal assessor information.
Ansonia Land Use
This map was created using land use data derived from 2012 NAIP satellite imagery, 2012 leaf-off aerial photography (CTDEEP), Google Streetview 2015 and municipal assessor information.


